Dashboards Tell You What Happened. Surfaces Tell You What's Happening.
Healthcare ops teams drown in dashboards that report the past. Surfaces push the right signal to the right person at the right time.
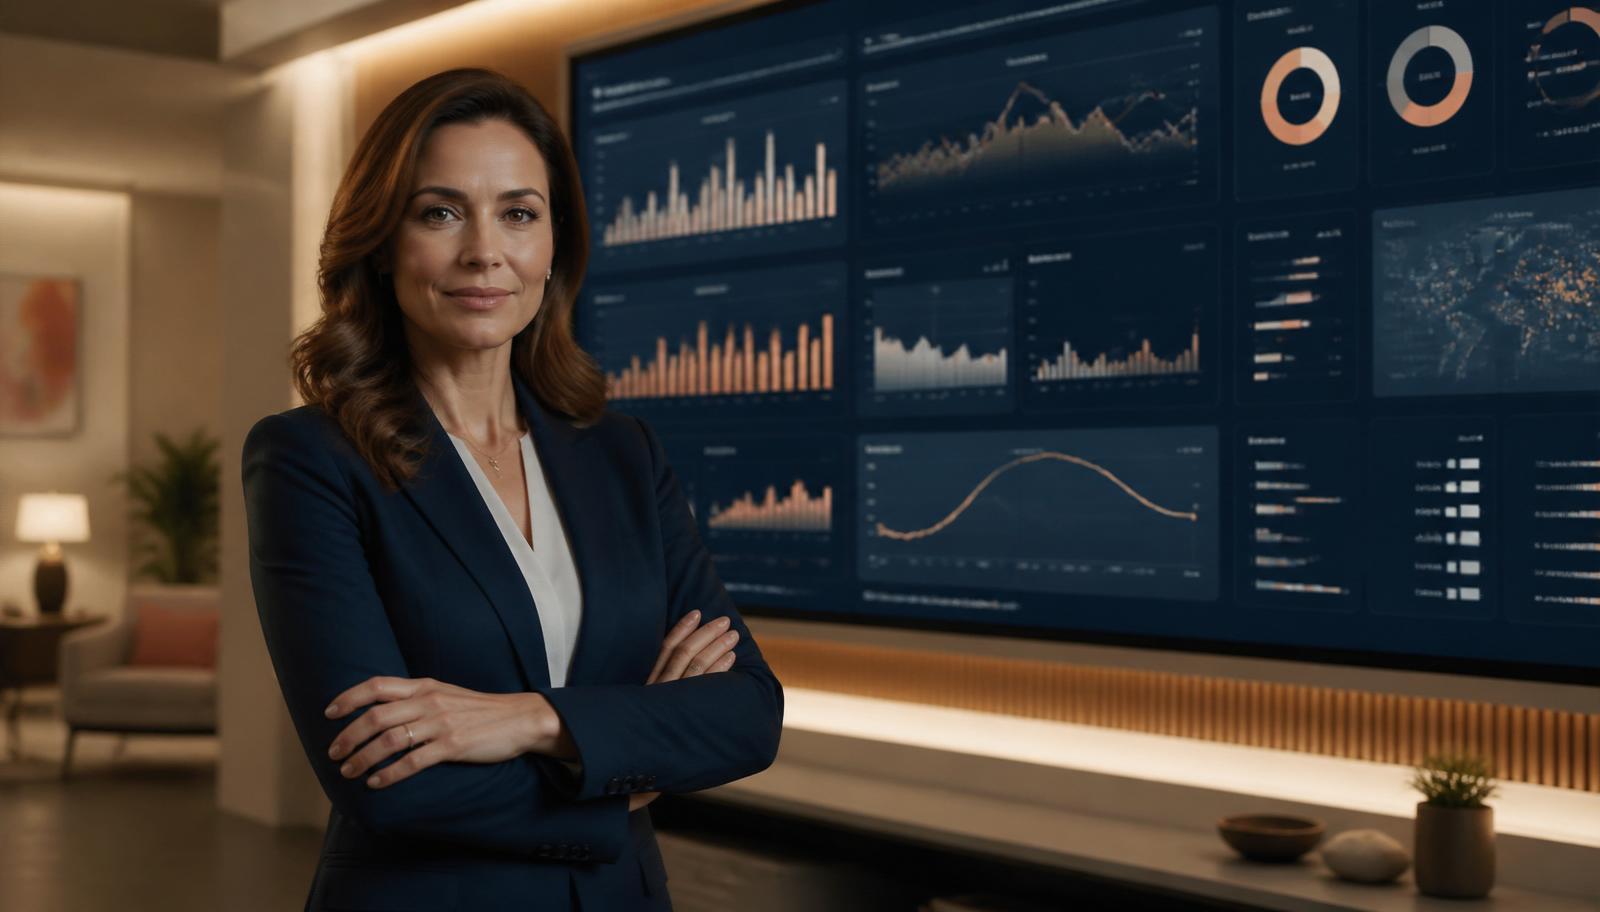
A large home health organization recently counted the dashboards its operations leadership checks each week. The answer was 23. Payer mix. Call volume. Complaint tracking. Referral conversion. CAHPS trending. Auth denial rates. Revenue cycle aging. Each one lives in a different system, refreshes on a different schedule, and answers a question someone asked six months ago.
Nobody checks all 23. Most people check three or four, glance at the same two metrics, and move on.
This is the state of healthcare operations intelligence in most organizations: backward-looking reports competing for the attention of people who do not have time to look at them.
Dashboard Fatigue Is Not a Discipline Problem
The instinct when dashboards go unused is to blame the people. They need training. They need fewer dashboards. They need better dashboards.
The actual problem is structural. Dashboards are passive instruments. They wait for someone to open them, interpret them, and decide whether what they see warrants action. That requires uninterrupted time and a mental model of what "normal" looks like for every metric on the screen.
In healthcare operations, that person does not exist. The VP of ops is in back-to-back meetings. The compliance officer is preparing for a survey. The RCM director is chasing a payer dispute. When they do open a dashboard, they see a snapshot frozen at whatever cadence the report runs. Daily at best. Weekly at worst.
A 2023 survey by HIMSS found that 76% of health system leaders said they had more data available than they could act on. The bottleneck is not data collection. It is signal delivery.
The Signals Are in the Calls, Not the Database
Here is where healthcare operations intelligence diverges from analytics in e-commerce or SaaS. In those industries, the critical signals live in structured data — click streams, purchase histories, ticket metadata. Dashboards work because the data is already in the system generating the report.
In healthcare contact centers, the significant signals are trapped in unstructured conversations. A patient says they are switching agencies. A caller reports a fall and the agent does not escalate. A scheduling call reveals a missed visit never documented.
These events do not generate a database row until someone listens to the call, identifies the event, and logs it. At a 2% QA sample rate, the vast majority never get captured.
No dashboard can surface what was never entered into the system it queries. Healthcare organizations have built sophisticated reporting on data sets that are structurally incomplete. The result is precise measurements of the wrong things.
What a Surface Is
A surface is not a better dashboard. It is a different model entirely.
Where a dashboard waits to be checked, a surface pushes. Where a dashboard reports aggregates, a surface delivers specific signals. Where a dashboard answers the question someone thought to ask last quarter, a surface detects the pattern no one anticipated.
The concept: monitor 100% of the signal source — every patient call — and route specific findings to the person who can act on them, while the action is still useful.
A compliance surface does not show a monthly trend line of HIPAA mentions. It flags the call from Tuesday at 2:14 PM where an agent disclosed a diagnosis to an unauthorized caller, and routes that flag to the compliance officer before end of day.
A churn risk surface does not produce a quarterly attrition report. It identifies the three patients who expressed dissatisfaction this week, tags the root causes — scheduling failures, caregiver complaints, long hold times — and delivers that to the retention team while those patients are still reachable. The same call flow carries caregiver no-shows and missed shifts; the operational specifics there are covered in call intelligence for home care agencies.
An operational surface does not display an average handle time chart. It detects that call duration on auth inquiries spiked 40% this week because a payer changed documentation requirements, and notifies the training lead before the next shift.
The difference is not cosmetic. It is the difference between a smoke detector and a fire investigation report.
Why Healthcare Is Ready for This Now
Three things converged.
First, the AI matured. Speech analytics that process every call in near real-time — not keyword spotting but contextual understanding — moved from research to production. Platforms like SurfacerIQ already process 100% of call volume for healthcare organizations. The signal capture problem is solved.
Second, organizations exhausted their existing analytics stack. After a decade of BI tools and data warehouses, most ops leaders know what their dashboards say. They also know what they miss. The appetite for a different model comes from being surprised by problems that were visible in retrospect but invisible in real time.
Third, the regulatory environment tightened. CMS quality reporting, CAHPS tied to reimbursement, state survey readiness, payer audits — the cost of a missed signal is higher than it was five years ago.
What Changes When Signals Find People
When healthcare operations intelligence shifts from pull to push, the effects compound.
Response times collapse. A compliance event identified the day it occurs gets remediated before it becomes a pattern. A patient expressing churn intent gets a callback within 24 hours instead of appearing in a quarterly attrition report.
Staffing decisions get sharper. When you see that 30% of calls on a service line are generating wait-time complaints, you do not need a six-week analysis cycle to justify adding capacity.
Audit readiness becomes continuous. The compliance team has a running feed of events requiring documentation or remediation. The survey does not surface surprises because the surfaces already did.
And dashboard count drops — not because someone mandated fewer reports, but because dashboards were a workaround for a delivery problem.
The Question to Ask
The next time you open a dashboard, ask one question: did this tell me something I did not already know, in time to do something about it?
If the answer is no — and for most healthcare ops dashboards, it is — the problem is not the dashboard. The problem is the model. Passive reporting served its purpose when the alternative was no reporting at all. But when the most critical signals are buried in conversations, not databases, waiting for someone to check a chart is not a strategy. It is a gap.
The signals are already there. Every call, every day. The question is whether they find the people who need them.
Keep exploring
Related resources
Quality monitoring →
Move from 2% sampling to reviewing every conversation.
Call transcription →
Accurate transcripts feeding QA, coaching, and audit trails.
HIPAA at SurfacerIQ →
Compliance posture for regulated contact-center operations.
More from Contact Center Operations
- After-Hours and Weekend Calls: The Coverage Gap Nobody Audits7 min
- Your CRM Is Logging Calls, Not Listening to Them5 min
- 100% Call Review vs Sampling: Why the Old QA Playbook is Costing You10 min
See SurfacerIQ in action
Calls in. Tickets out. Automatically. See how it works on a real call.
Keep reading
After-Hours and Weekend Calls: The Coverage Gap Nobody Audits
Hospice has a federal 24/7 availability requirement. Home health does not. Both are fully responsible for what happens on the after-hours calls they take, and almost nobody reviews them.
Your CRM Is Logging Calls, Not Listening to Them
Healthcare CRMs capture what agents type, not what patients say. Here's where CRM call data falls short and what a surface-level approach reveals.

100% Call Review vs Sampling: Why the Old QA Playbook is Costing You
Sampling made sense when reviews were manual. AI-driven 100% call review changes what QA, coaching, and compliance look like — and how much revenue leaks through the gaps.